C²oBra User Resources
C Coverage Branch Testing — Source-Level Branch Coverage Instrumentation for C
What is C²oBra?
C²oBra is a source-level branch coverage instrumentation tool for C programs. It automatically instruments C source files to track which branches are executed during testing, then reports coverage results as interactive HTML and CSV reports with a VS Code-style source view, a summary dashboard, and full CI/CD integration via GitHub Actions.
Each branch construct (if, while, for, do-while, switch, ternary) produces two tracked edges — a true path and a false path. Coverage is calculated as:
coverage % = (true_branches_hit + false_branches_hit) / total_branches × 100
System Requirements
🖥️ Operating System
Ubuntu or Debian-based Linux. WSL (Windows Subsystem for Linux) is fully supported.
🐍 Python
Python 3.10 or later with python3-venv for virtual environment support.
⚙️ GCC
GCC compiler with gcc-multilib for 32-bit compilation support required by Sikraken.
🔬 Sikraken
Required for symbolic execution and automatic test input generation on input-driven benchmarks.
Installing Sikraken
- Download from zenodo.org/records/18062402
- Extract to
~/sikraken/so the main script is at~/sikraken/bin/sikraken.sh - Fix execute permissions (the zip does not preserve them):
chmod +x ~/sikraken/bin/sikraken.sh
chmod -R +x ~/sikraken/bin/
chmod -R +x ~/sikraken/eclipse/
Installation
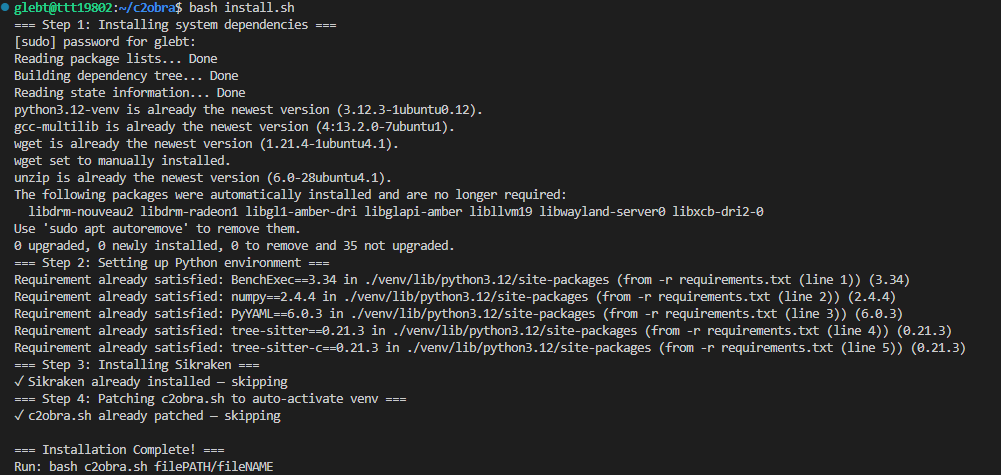
Option A — Quick Install (Recommended)
git clone https://github.com/GlebTut/c2obra.git
cd c2obra
chmod +x install.sh
bash install.sh
Option B — Manual Setup
sudo apt install python3.12-venv gcc-multilib
git clone https://github.com/GlebTut/c2obra.git
cd c2obra
python3 -m venv venv
source venv/bin/activate
pip install -r requirements.txt
Smoke Test
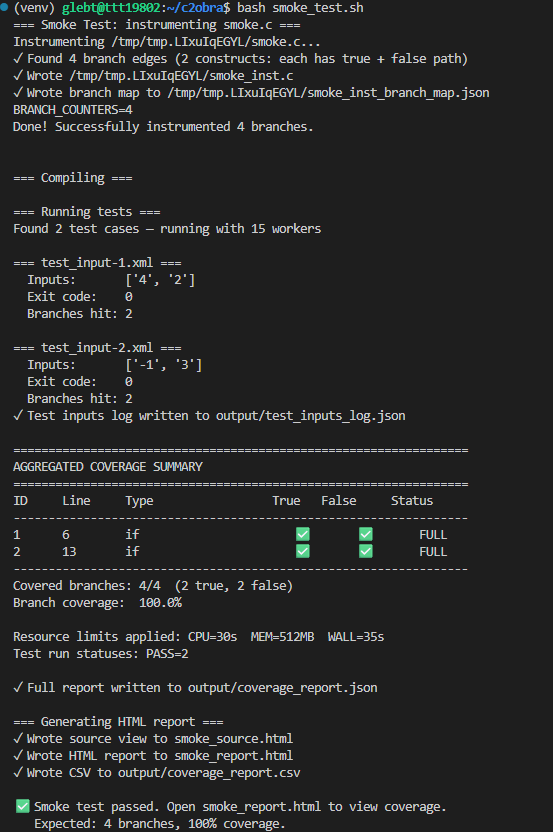
After installation, run the smoke test to verify that instrumentation, compilation, execution, and reporting all work end-to-end on a minimal example.
bash smoke_test.sh
Expected output:
✓ Found 4 branches (2 branch constructs)
Branch coverage: 100.0%
✅ Smoke test passed. Open smoke_report.html to view coverage.
How to Use
Run on a Single C File
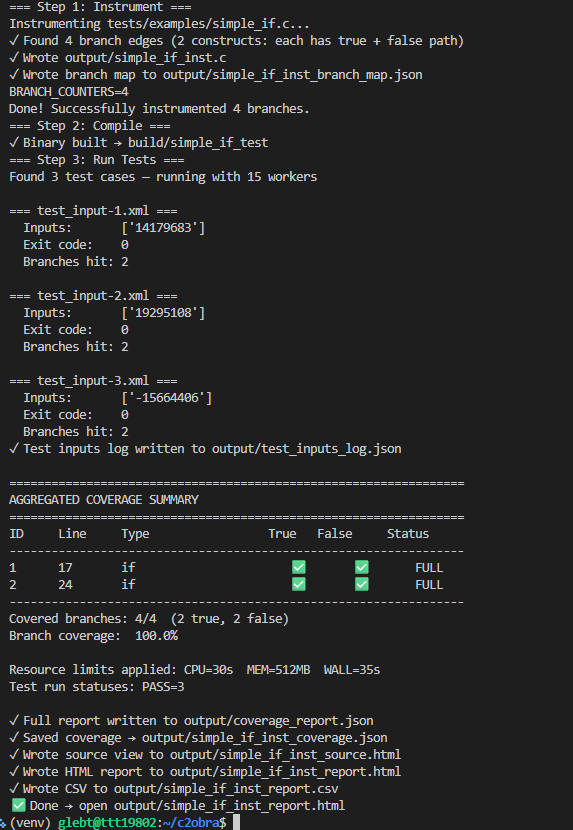
bash c2obra.sh path/to/file.c
The pipeline auto-detects whether the file uses __VERIFIER_nondet_* inputs and runs Sikraken if needed. It then instruments, compiles, runs all tests, and generates a report.
Example output:
=== Detected: input-driven file ===
=== Step 0: Run Sikraken ===
✓ Sikraken done → ~/sikraken/sikraken_output/benchmark01/test-suite
=== Step 1: Instrument ===
=== Step 2: Compile ===
=== Step 3: Run Tests ===
=== Step 4: Report ===
✓ Wrote report to output/benchmark01_inst_report.html
Run on a Directory
bash c2obra.sh path/to/directory/
Recursively instruments all .c files, assigns globally unique branch IDs, runs each benchmark, and generates output/summary_report.html.
Run a Timed Benchmark
bash benchmark_cobra.sh PATH/TO/FILE.c PATH/TO/test-suite
Outputs structured per-step timings for instrumentation, compilation, test execution, and report generation:
========================================
 RESULTS: Problem_16
========================================
 Coverage:      17.9%
 Branches:      2592 / 14472
----------------------------------------
 Instrument:    4253ms
 Compile:       5317ms
 Run tests:     462ms
 Report:        8469ms
 TOTAL:         18501ms
========================================
Generate Reports Manually
source venv/bin/activate

# Single file report
python3 src/report.py output/benchmark_inst_branch_map.json output/benchmark_inst_coverage.json

# Summary across all benchmarks
python3 src/merge_reports.py output/
Run Status Classification
| Status | Condition |
|---|---|
pass | Clean exit — full coverage data saved |
partial | Timeout or crash — branch data was still saved |
timeout | Timed out with no branch data saved |
crash | Signal kill (SIGSEGV / SIGABRT / SIGFPE), no data |
Partial coverage is always preserved — no coverage data is lost regardless of how a run terminates.
Reading the Reports
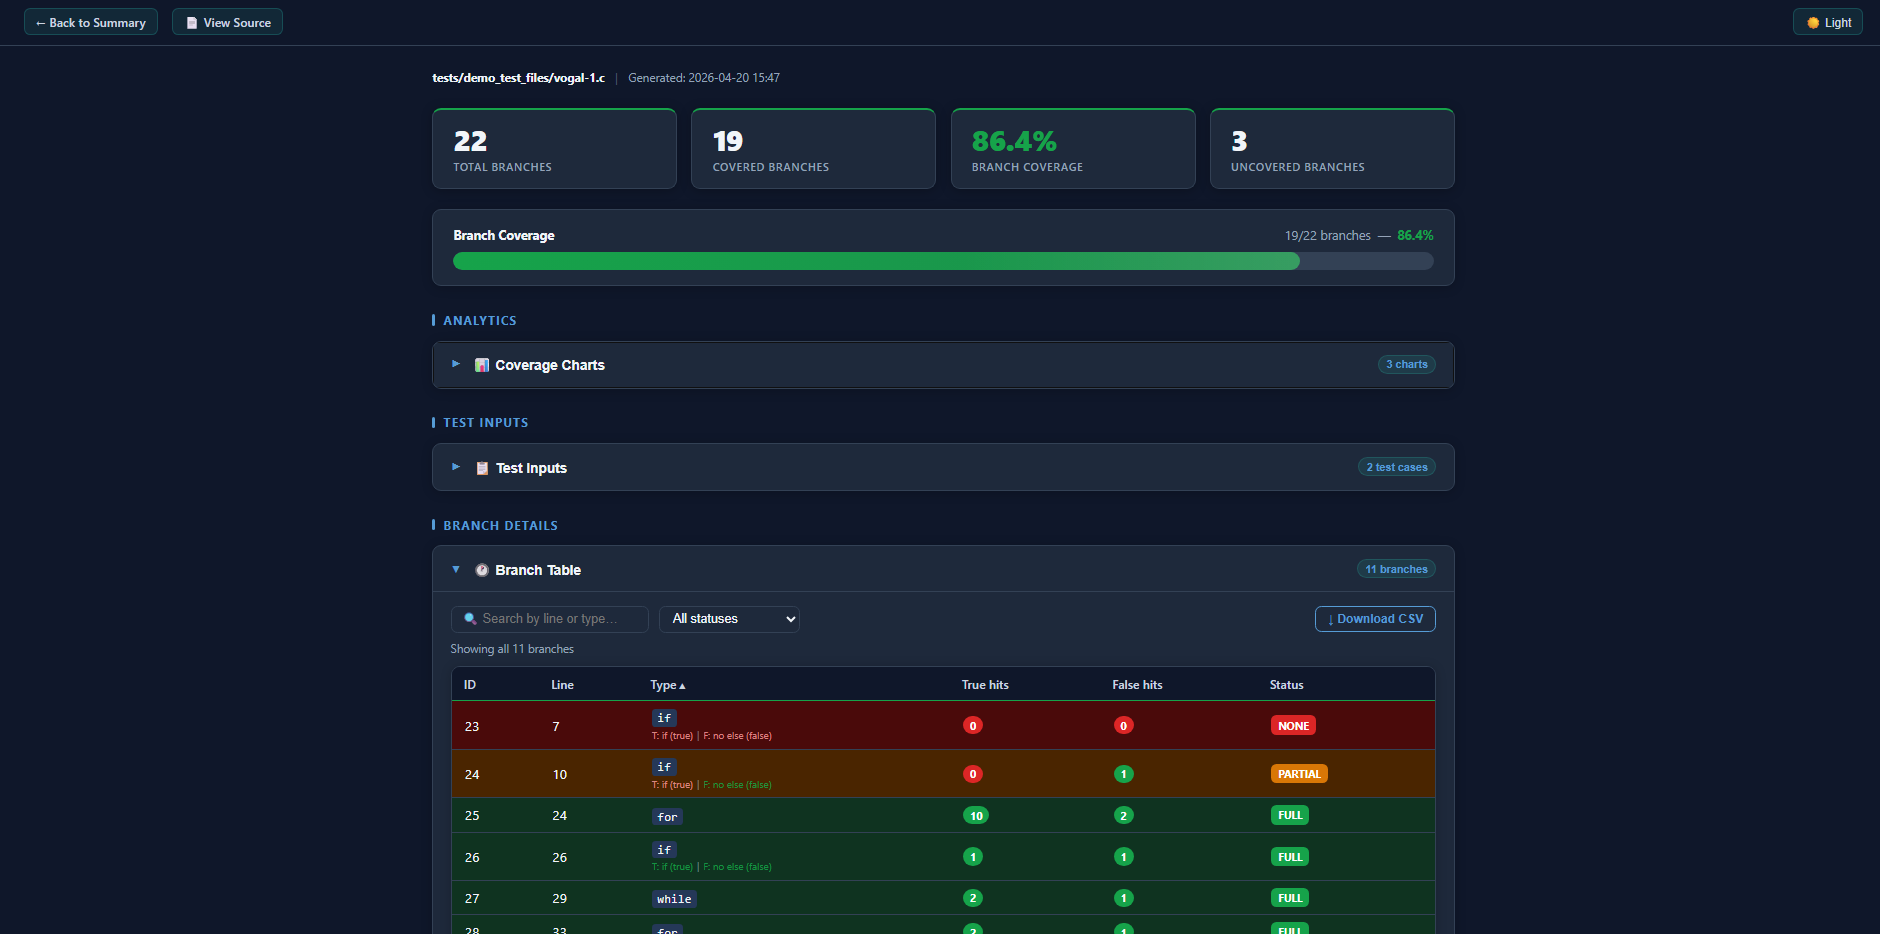
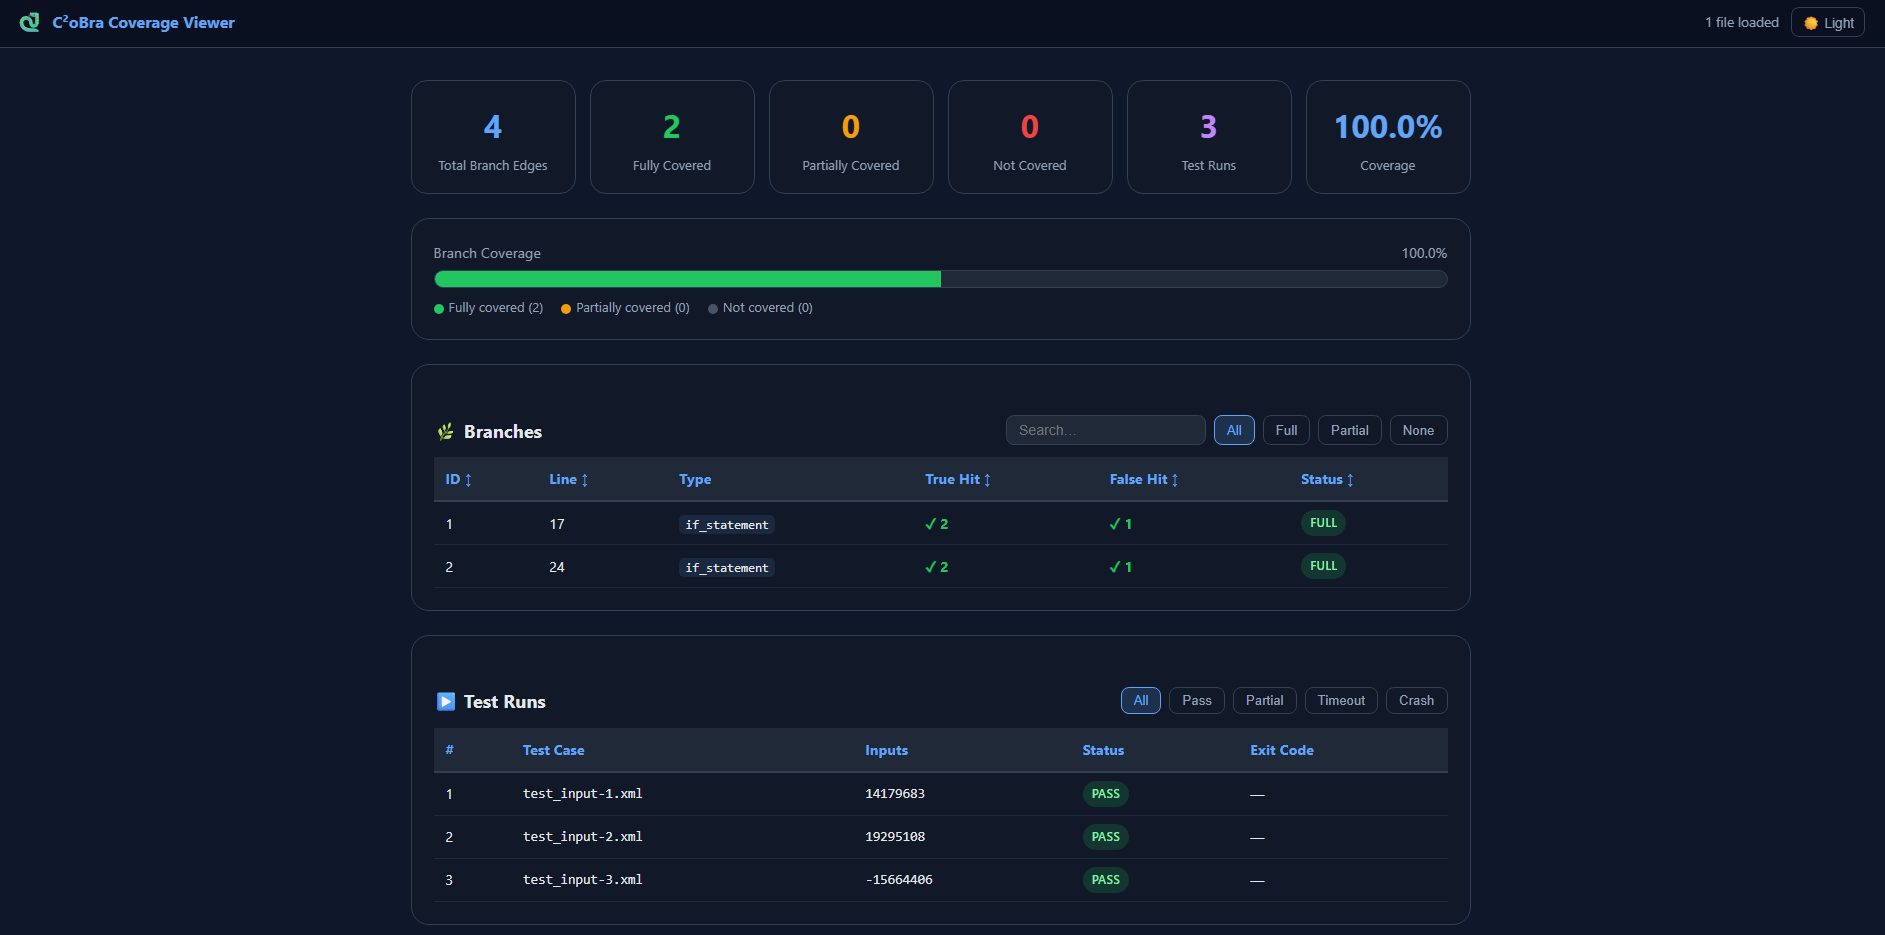
HTML Coverage Report
The main report shows per-branch hit/miss status, true/false edge coverage, run-status badges for each test input, dark/light mode toggle, sorting, and filtering. Open output/*_report.html in any browser.
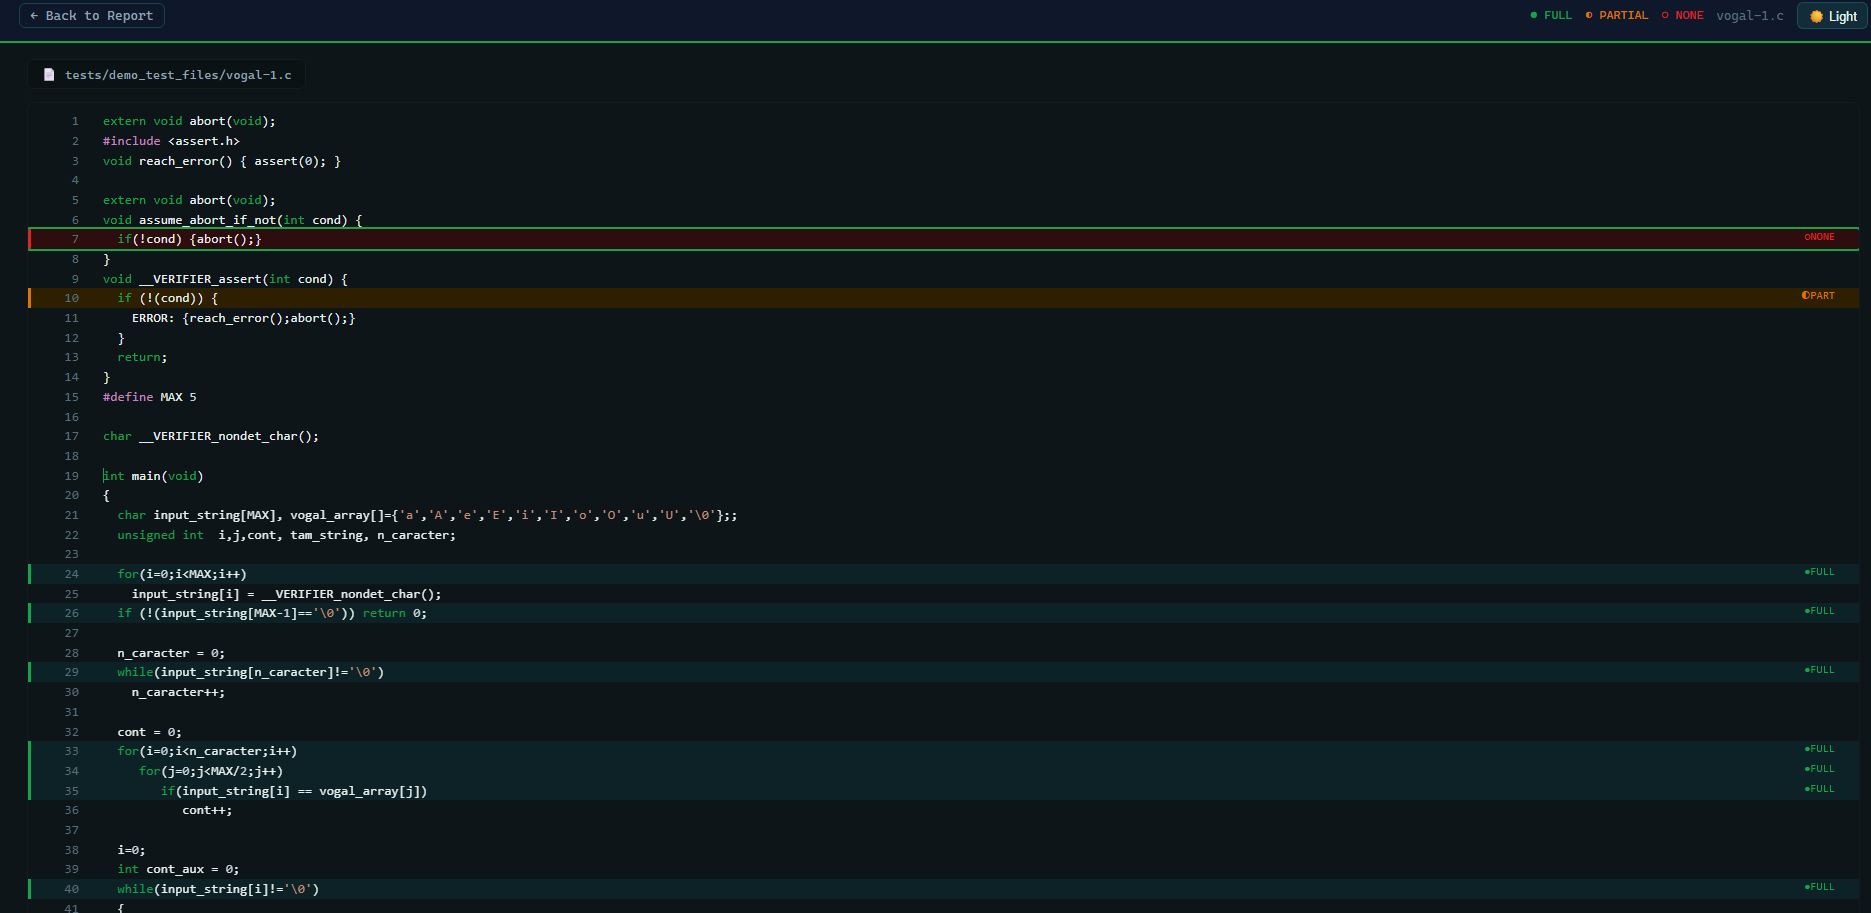
Source View
The VS Code-style source view highlights branch lines — green for covered, red for missed. Open output/*_source.html.
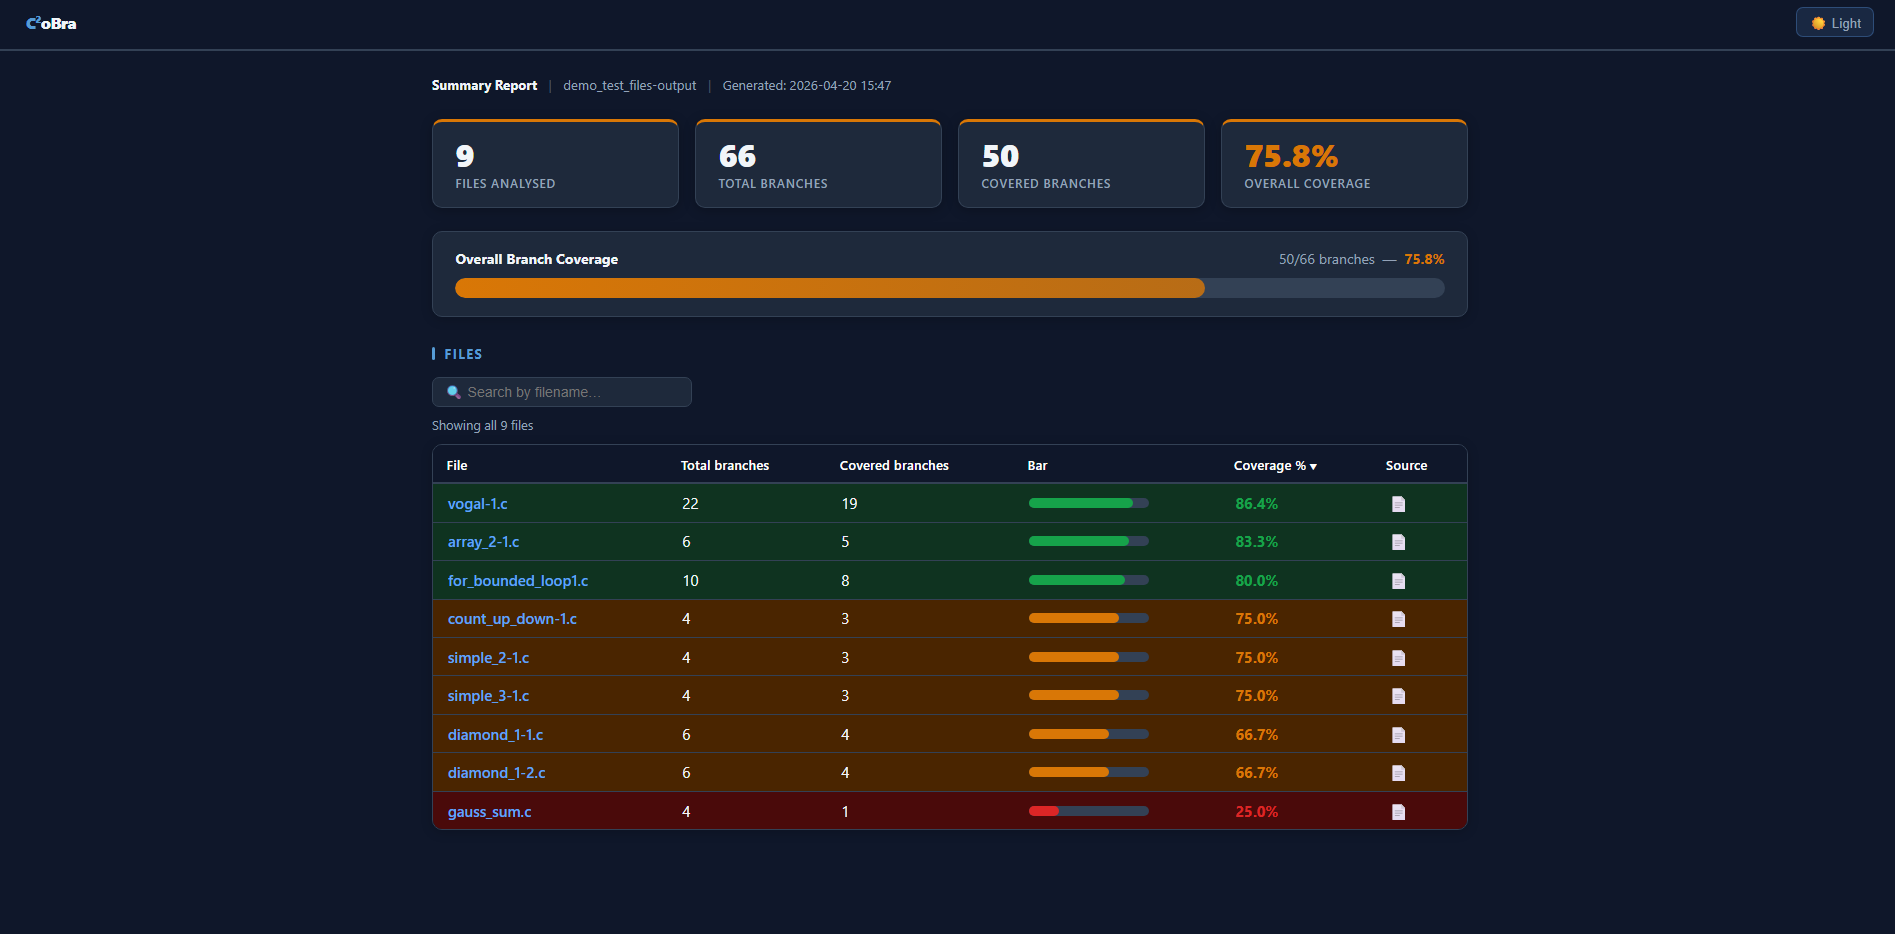
Summary Dashboard
When running on a directory, output/summary_report.html shows KPI cards, a progress bar, and a per-file table with coverage %, branch counts, and colour-coded rows.
Local Viewer — covcheck.html
Open covcheck.html in your browser and drag-and-drop any coverage_report.json to inspect results locally — no server required. Supports multi-file comparison mode.
FAQ
Why does python3 -m venv venv fail with "ensurepip is not available"?
The python3-venv package is not installed. Fix it with:
sudo apt install python3.12-venv
Why does Sikraken fail with Permission denied on .sh or eclipse binaries?
The Sikraken zip archive does not preserve execute permissions. Run both:
chmod -R +x ~/sikraken/bin/
chmod -R +x ~/sikraken/eclipse/
Why do I get bits/wordsize.h: No such file or directory?
Sikraken requires 32-bit compilation support. Install the multilib package:
sudo apt install gcc-multilib
Why does a benchmark show 0% coverage after a successful run?
The binary was likely terminated before branch coverage data was flushed to disk. Always run through bash c2obra.sh rather than executing the binary directly — the script uses a two-stage kill (SIGTERM then SIGKILL) to ensure coverage is saved before the process exits.
What does a "partial" badge mean in the report?
A partial run means the test timed out or crashed, but branch data was saved before termination and is included in the coverage total. No coverage data is ever discarded.
Why does C²oBra show a higher branch count than other tools?
C²oBra uses syntactic AST-level instrumentation via tree-sitter, so it counts all branches including unreachable ones (dead code, uncalled functions). Tools like TestCov apply post-compilation reachability filtering to reduce the denominator. Reachability-aware filtering is planned for a future iteration.
Support & Links
📚 Citation
Tutubalin, G. (2026). C²oBra: A Source-Level Branch Coverage Instrumentation Tool for C Programs. SETU, Ireland.